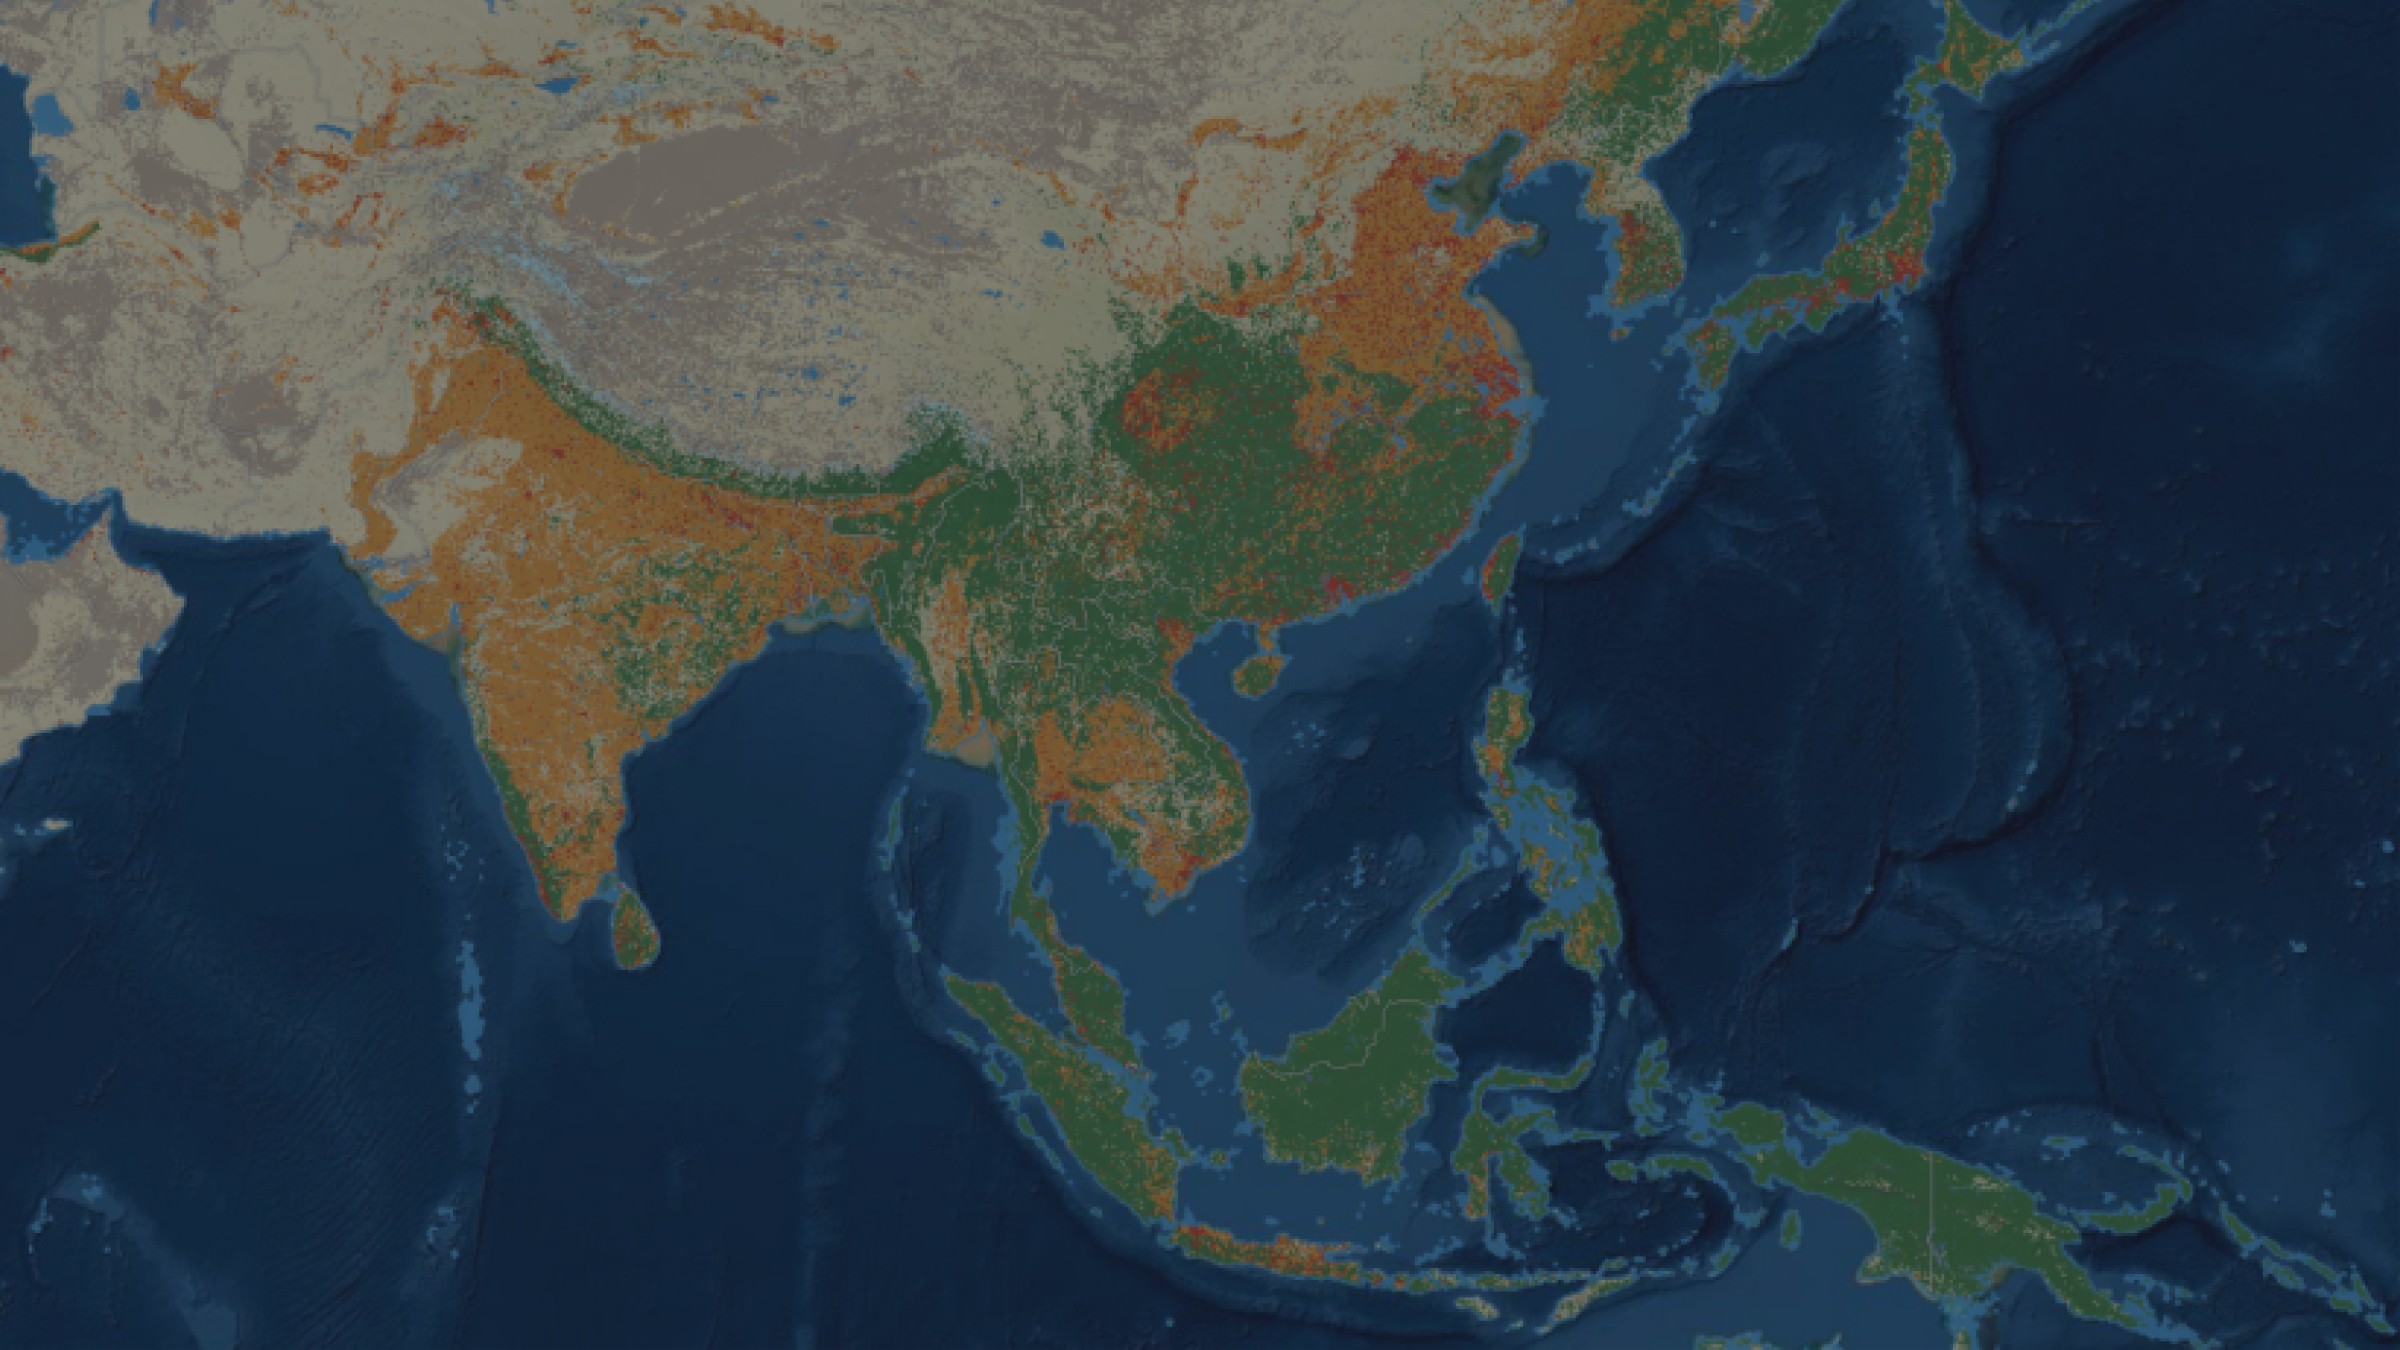
Available to all users
Global maps are released open source (CC BY 4.0) in partnership with Esri and Microsoft
Industry leading
10 meter resolution with 85% overall accuracy. Proven to be industry-leading from third parties
9 land cover classes
Standard land cover types for a continuous map of the world
Annual updates
Up-to-date annual land cover maps from 2017 to the most recent full year
The most up-to-date maps of the world
Impact Observatory’s innovative AI-powered methods automate and accelerate Land Use Land Cover mapping and monitoring in near-real-time. IO Monitor uses a unique deep learning approach to classify land use and land cover categories globally using state-of-the-art Copernicus Sentinel-2 imagery. Custom land use and land cover change maps are available for any area of interest over user-specified time periods, from 2018 to the present.
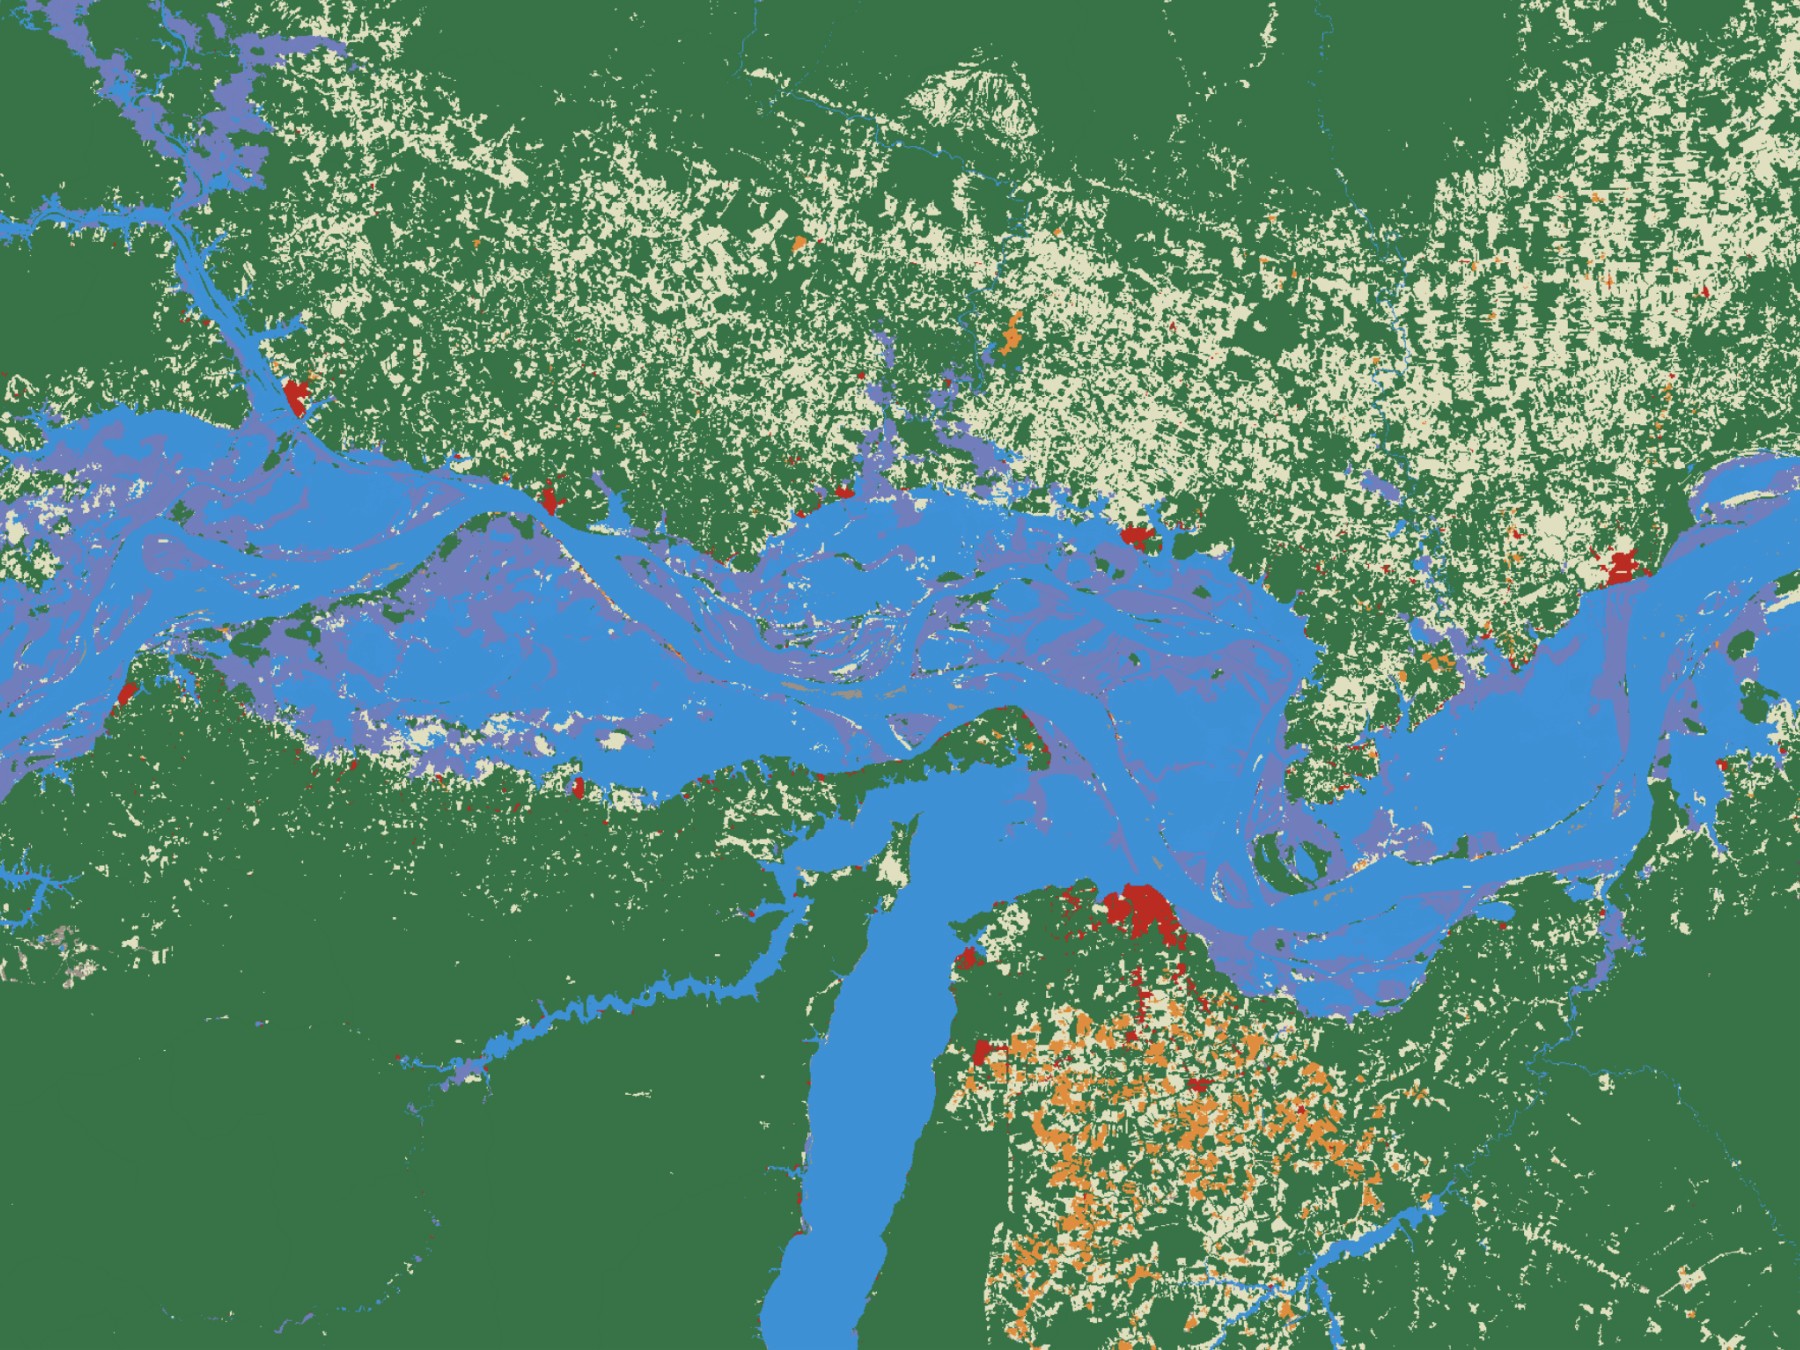
Quantitative insights for sustainable decision-making
Enable data-driven decision-making for science, governments, and organizations with numbers-based insights on land cover types, provided as pre-calculated metrics with every download.
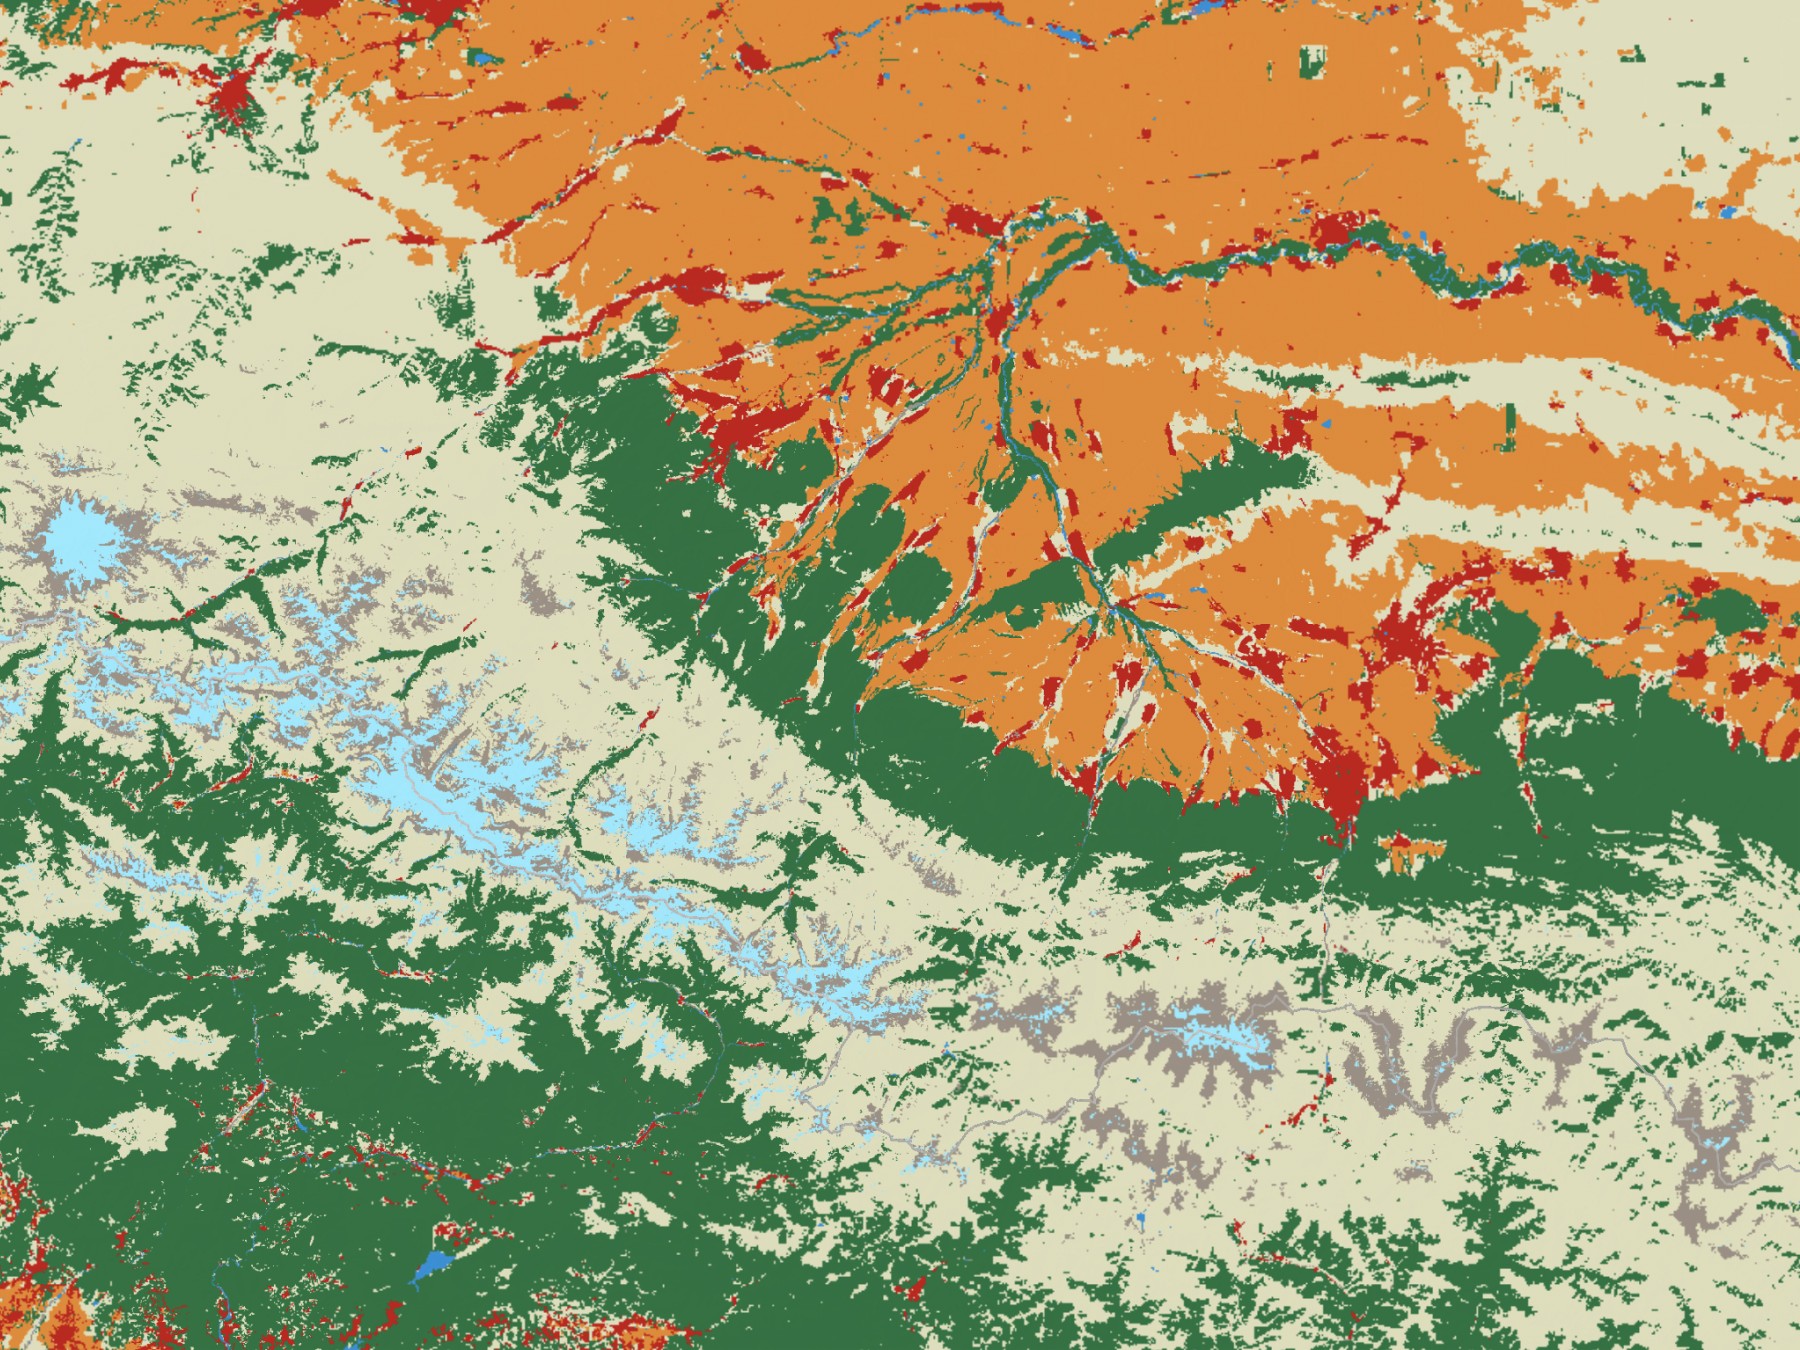
Track environmental and social conditions
Use land cover maps to understand patterns anywhere on Earth, such as urbanization, forest loss and gain, changes in cropland, rangeland, snow and water levels.
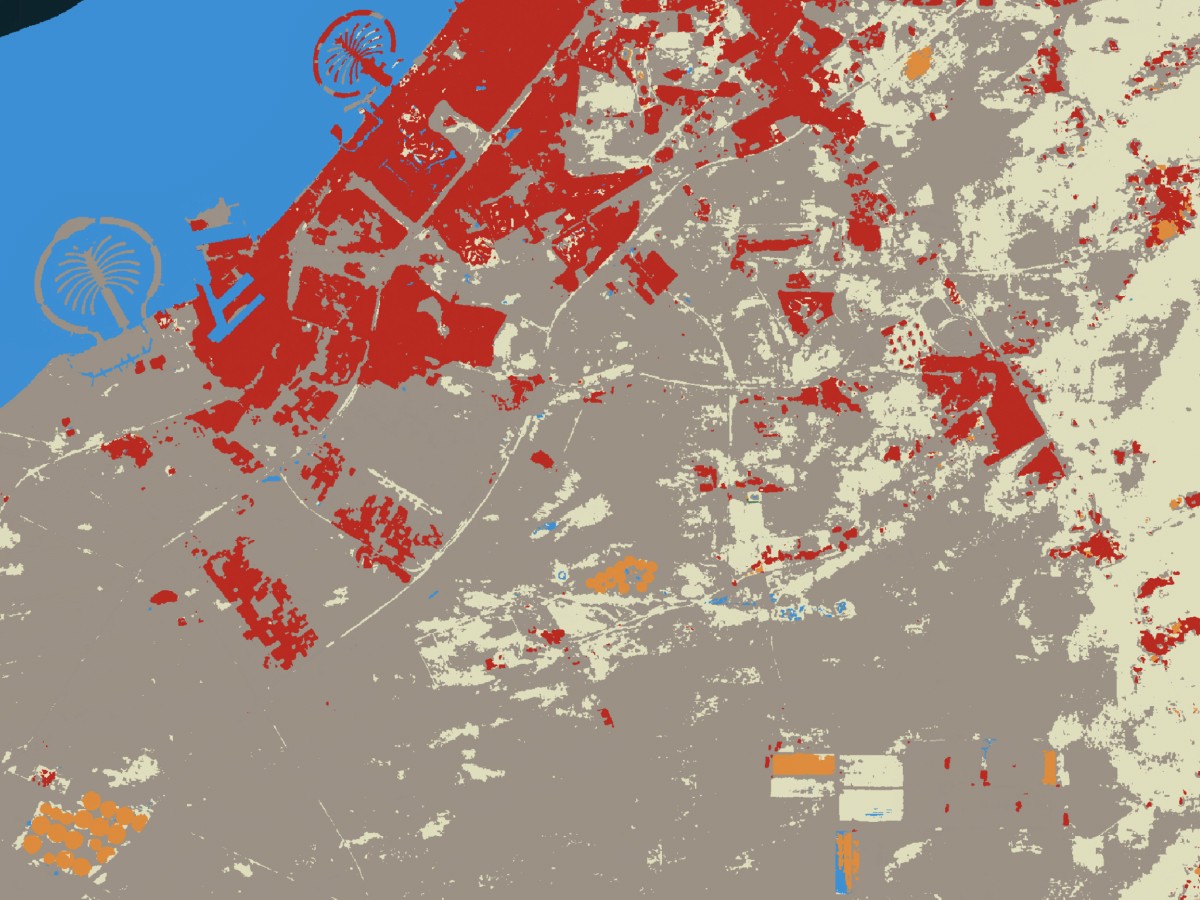
Seven year history of data for large-scale changes
A time series from 2017 to the most recent year tells the story land cover in any place over time.
Download a map in minutes with IO Monitor
Maps available as images, no technical skills required
Use pre-calculated metrics for summary statistics
Clip maps to your area of interest
9 land cover classes at industry leading accuracy
Annual maps for 2017 to the most recent year
Behind the Scenes
We use AI-powered analysis of images from the Sentinel-2 satellite to release open data products on all major geospatial platforms, including Esri Living Atlas, Microsoft Planetary Computer, and AWS Registry of Open Data.
Land Use Land Cover Map over Kyoto, Japan

Our Land Cover Maps
Find the map that helps you meet your goals, by comparing Impact Observatory's map offerings.
| Maps for Good | 10m Land Cover | 3m Land Cover | |
|---|---|---|---|
| Spatial Resolution | 10 meters | 10 meters | 3 meters |
| Spatial Extent | Custom area of interest | Custom area of interest | Custom area of interest |
| Date Range | Annual | Custom seasonal or annual dates | Custom seasonal or annual dates |
| Length of Archive | 2017–2023 | 2017–Present | 2020–Present |
| Best Suited for | Broad long term land cover analysis | Monitoring dense and sparse vegetation types and built areas, active and inactive croplands, and seasonal water patterns | Monitoring land cover types within urban areas including roads, buildings, mixed vegetation, other built areas |
| Categories | 9 classes Water Trees Rangeland Flooded Vegetation Crops Built Area Bare Ground Snow/Ice Clouds | 15 classes Water Channel Extent Variable Water Persistent Water Dense Trees Sparse Trees Dense Rangeland Sparse Rangeland Flooded Vegetation Active Cropland Inactive Cropland High Density Built Low Density Built Bare Ground Snow/Ice Clouds | 17 classes Water Channel Extent Variable Water Persistent Water Dense Trees Sparse Trees Dense Rangeland Sparse Rangeland Flooded Vegetation Mixed Vegetation Active Cropland Inactive Cropland Building Other Built Bare Ground Road Snow/Ice Clouds |
| Imagery Sources | Sentinel-2 | Sentinel-2 | PlanetScope & Sentinel-2 |
| Available File Types | Cloud Optimized GeoTIFF (COG), PNG and CSV | Cloud Optimized GeoTIFF (COG), PNG and CSV | Cloud Optimized GeoTIFF (COG), PNG and CSV |
| Price | Free | $2/km2 | $7.50/km2 |
Dive into the Details
Explore additional resources to improve your understanding of our Maps for Good offering
Comprehensive Documentation
Additional product details, tutorials, and release notes.
Methodology and Accuracy
Learn more about how our maps achieved 85% overall accuracy.
9 Land Cover Classes
Get detailed descriptions of each of our land cover classes.
Compare Land Cover Data
Proven quality based on an independent review.

Discover your possibilities!
Create your own custom map or talk to one of our sales team members