IO MONITOR
10m Land Cover
On-demand seasonal or annual insights with comprehensive land cover classes
Unlock insights
Monitor a growing range of seasonal land cover types for insights at 10 meter resolution.
Inform decisions
Receive reports on where and when changes are occurring in your area of interest.
Continuous updates
Compare seasonal land cover maps from 2017 up to the most recent Sentinel-2 satellite imagery for a time series of insights.
Simple pricing
Standard pricing up to 15,000km² with tiered pricing available for larger areas.
Spotlighting change in the areas you care about
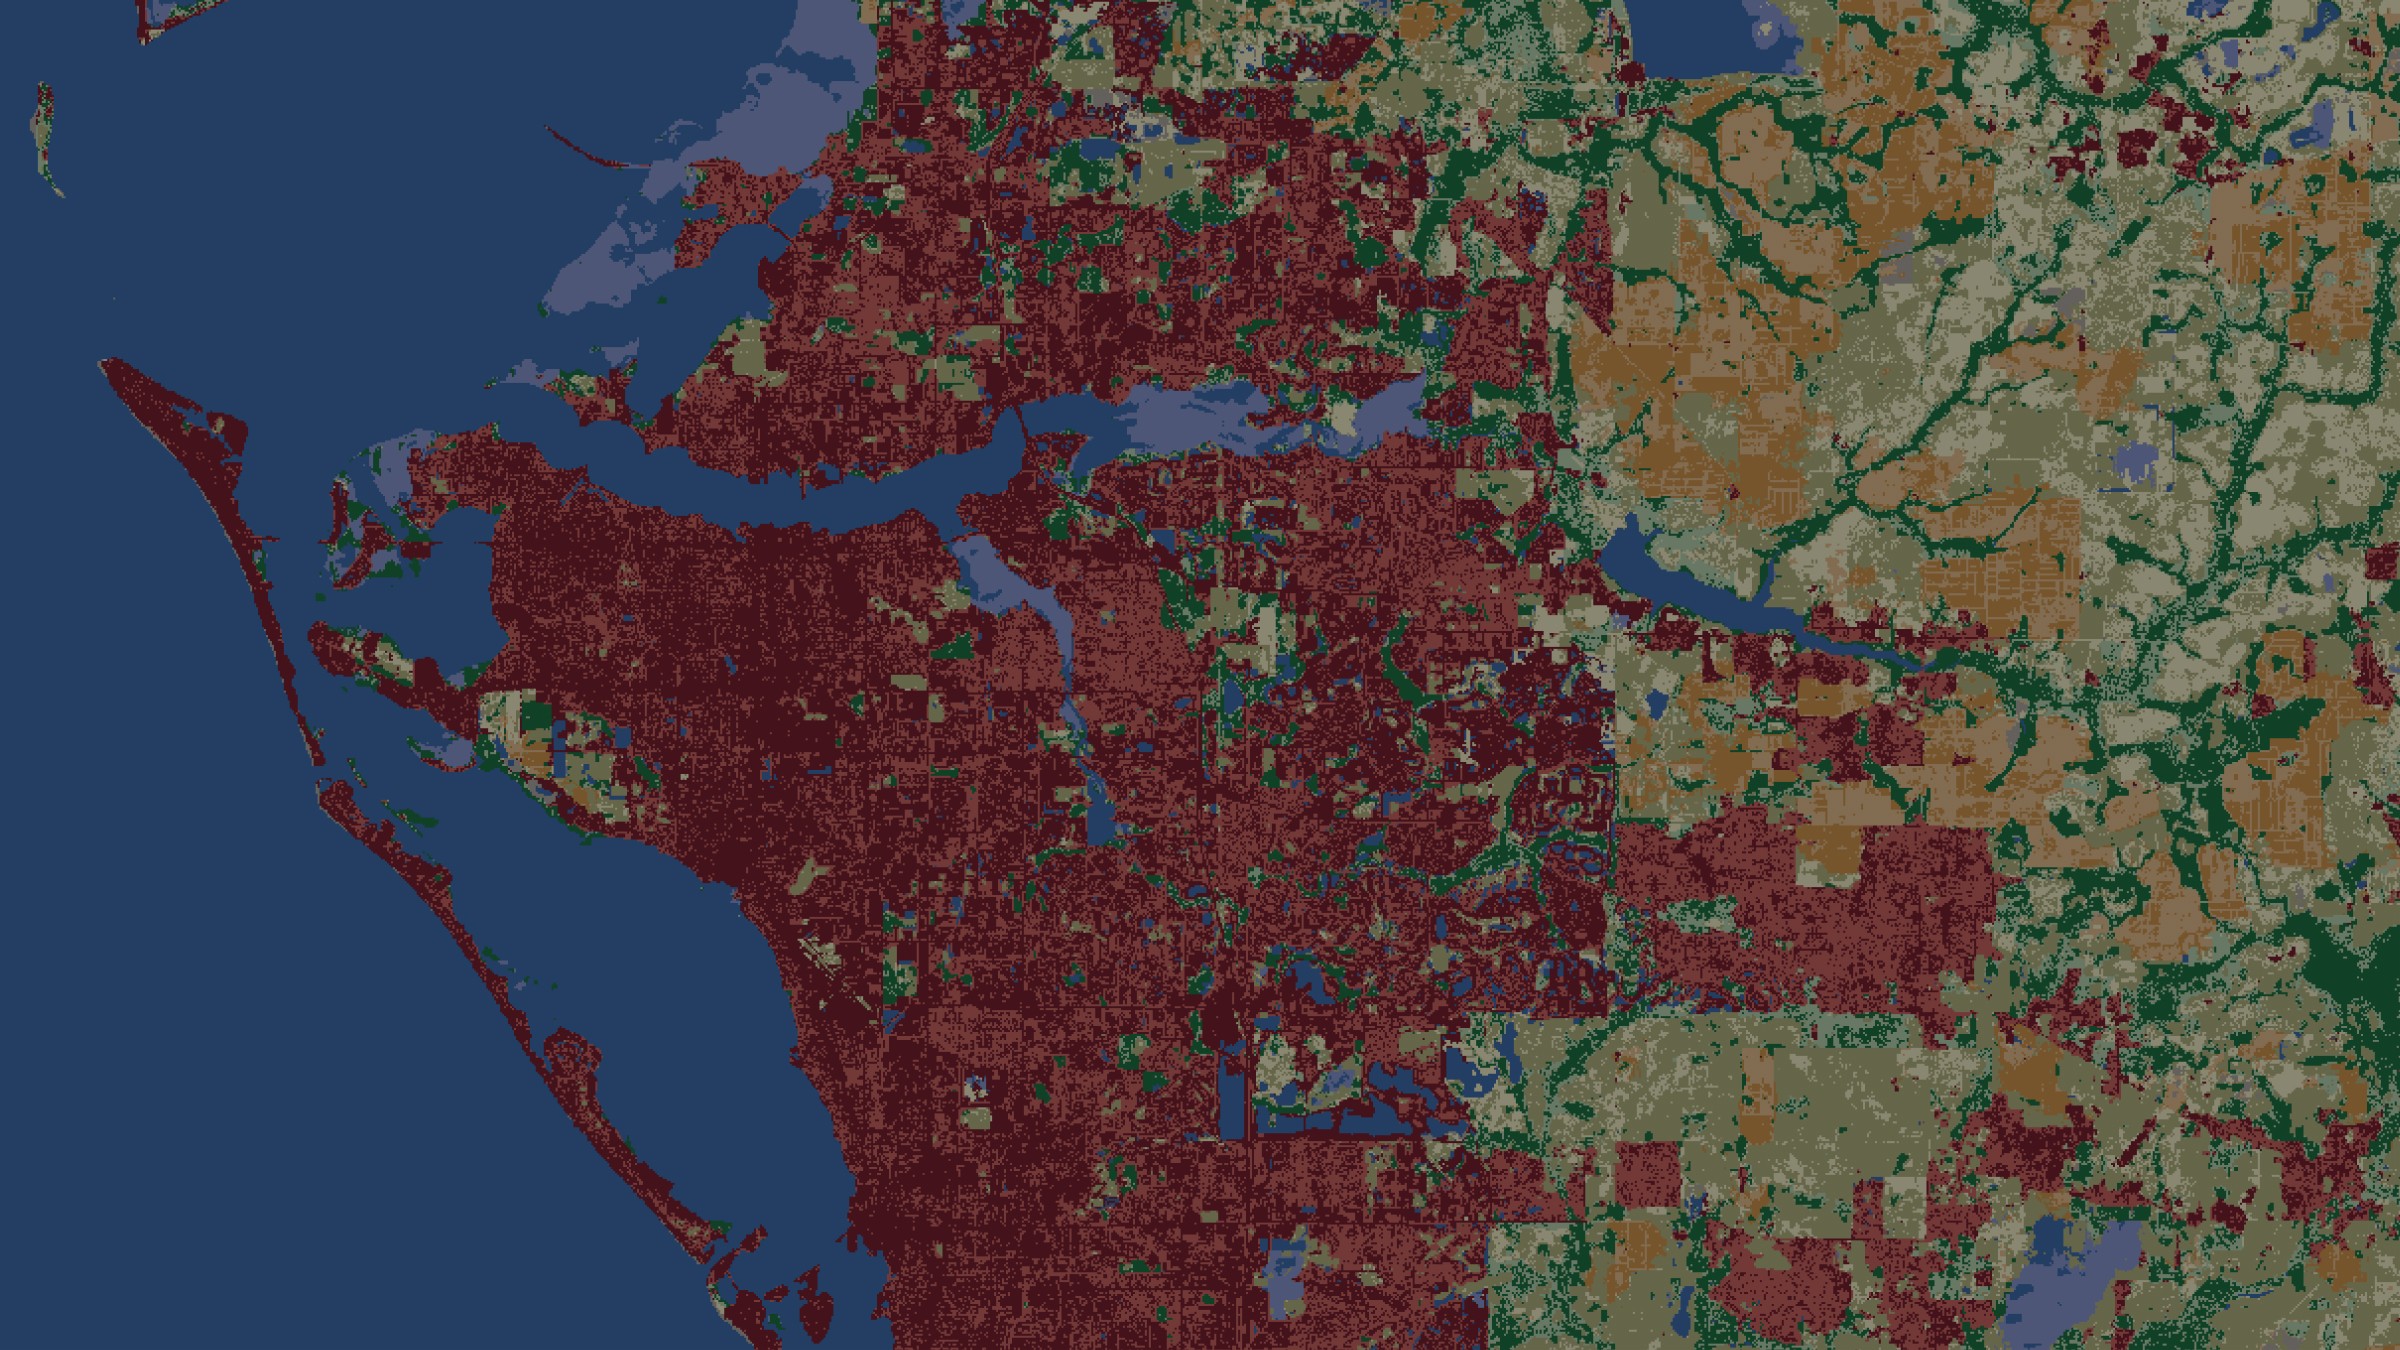
Innovative AI-powered methods automate and accelerate mapping and monitoring in near-real-time. IO Monitor uses a unique deep learning approach to classify land use and land cover categories globally using the state-of-the-art Copernicus Sentinel-2 imagery.
Land Use Land Cover Map over Bradenton, Florida. Derived from Sentinel-2 satellite imagery

Monitor what matters to you with custom orders
More detail with 15 land cover classes
User-defined areas of interest
Track historical patterns with seasonal variations
Data creation and delivery within hours
Customize date ranges based on local seasons
Easy integration with Esri ArcGIS products
Email, Microsoft Azure, or Amazon AWS delivery
Data for better decision making
Detect patterns to enable data-driven decision-making with a clear and up-to-date understanding of any place on Earth.
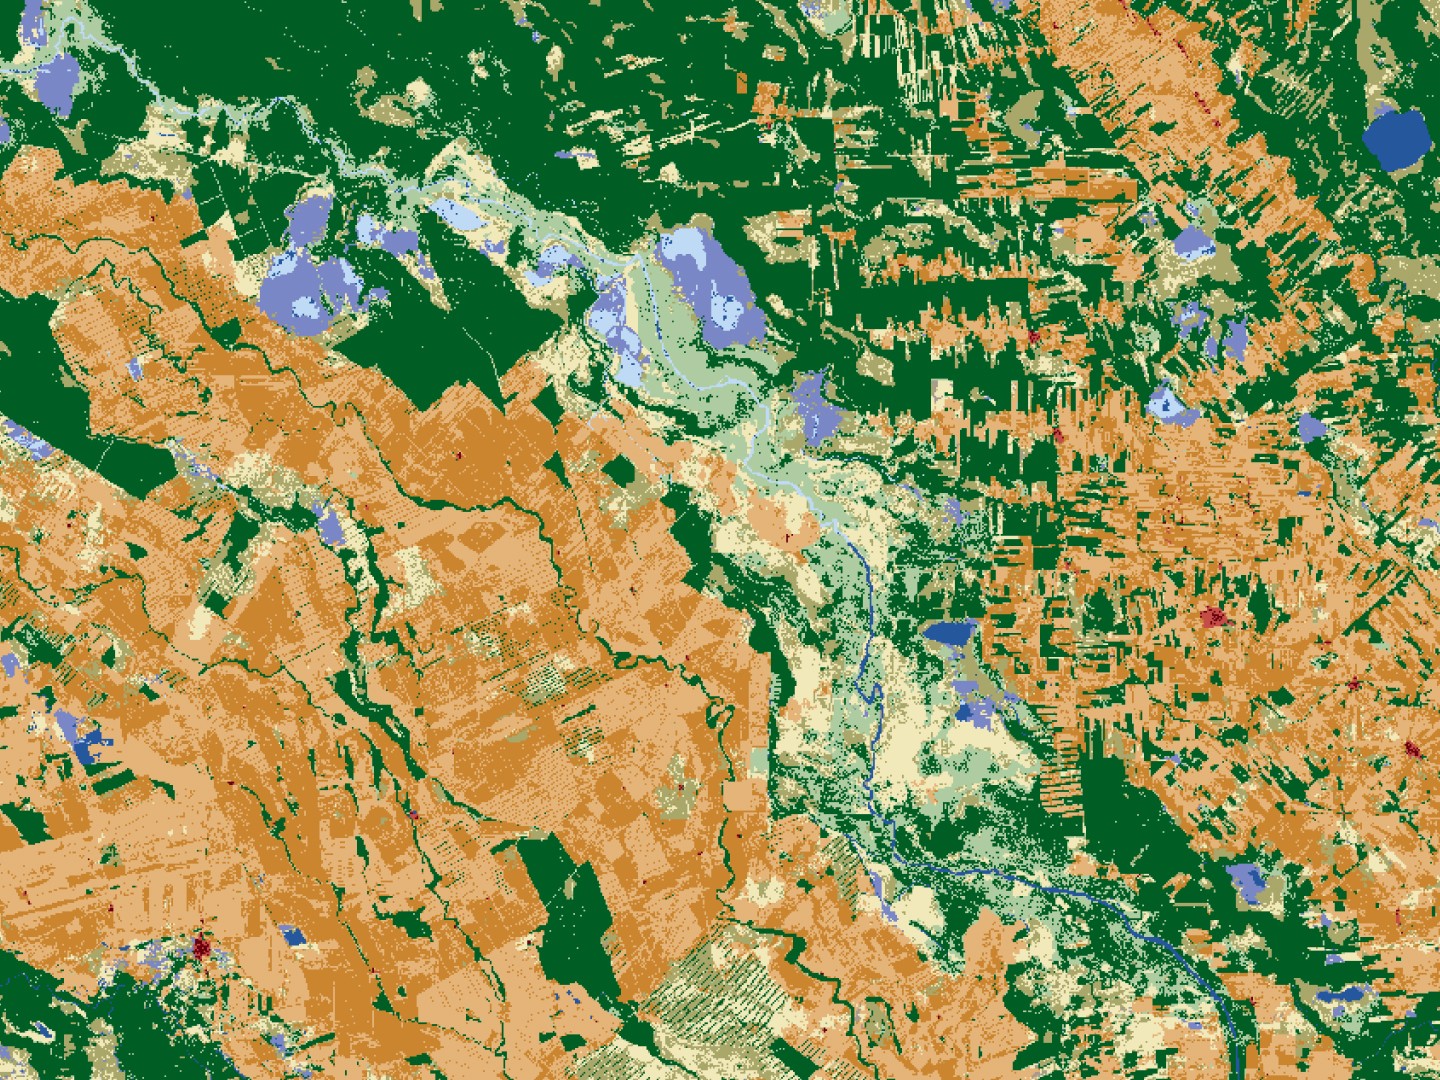
Assess risks to food systems and surrounding ecosystems
Identify changes in agriculture practices and fallow or abandoned crops with Active or Inactive Cropland classes.
Food and Farming Sample Data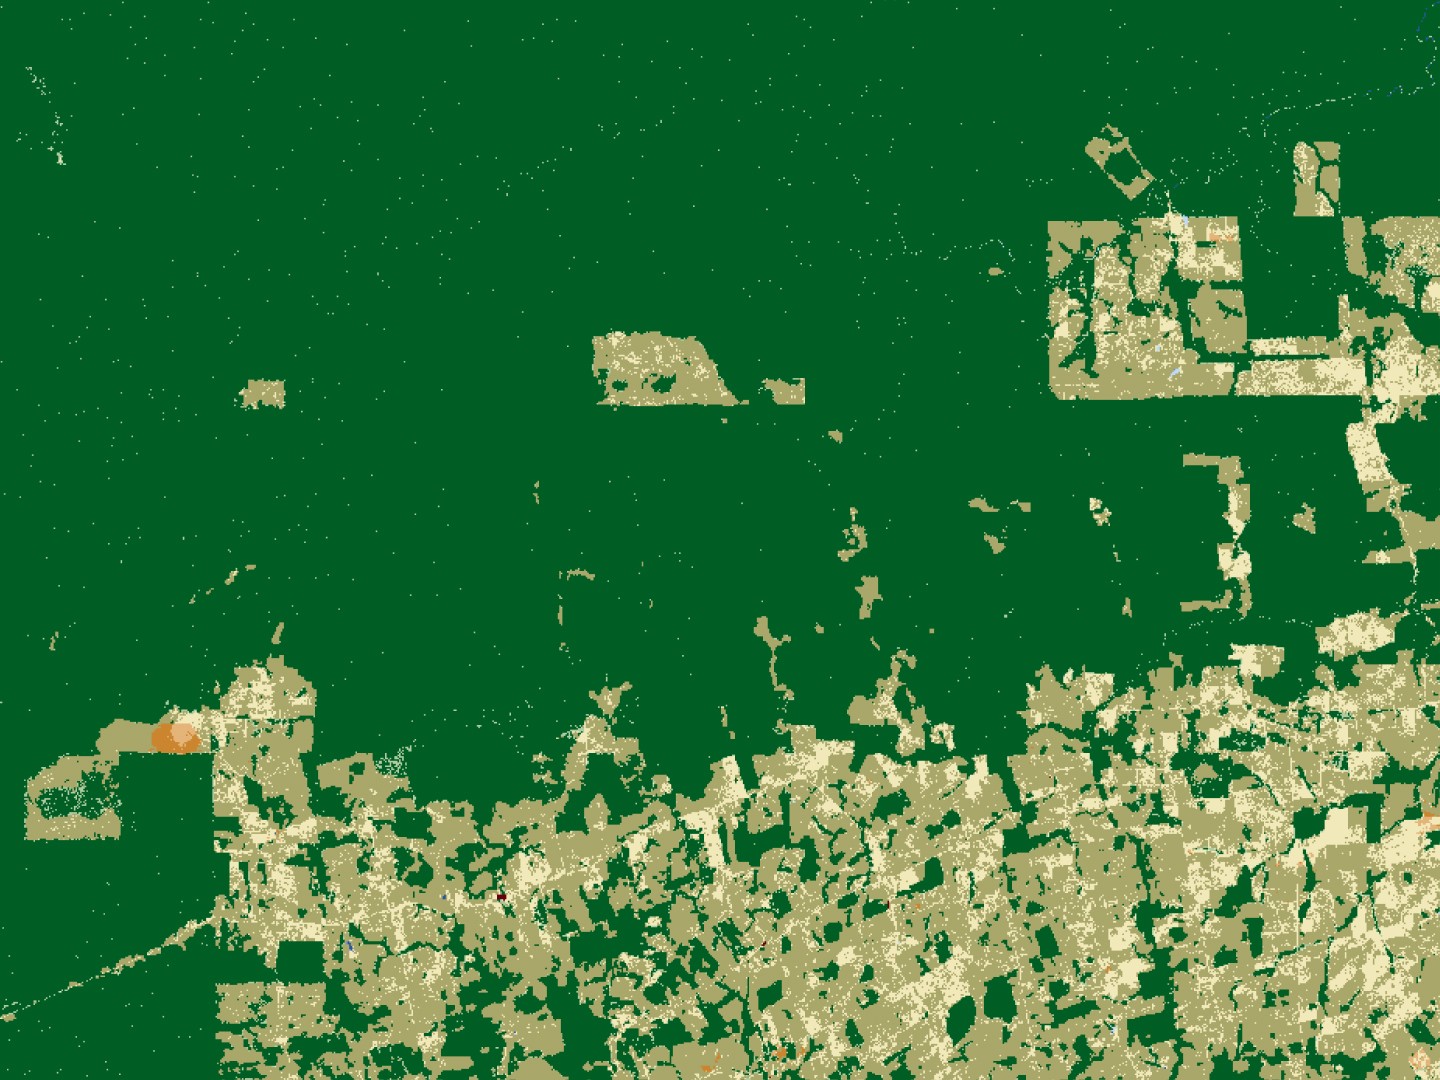
Identify risks for supply chains
See where, when, and how much supply chains affect loss or gain of critical natural ecosystems through changes in Dense Rangeland, Sparse Rangeland, and Trees classes
Sustainable Sourcing Sample Data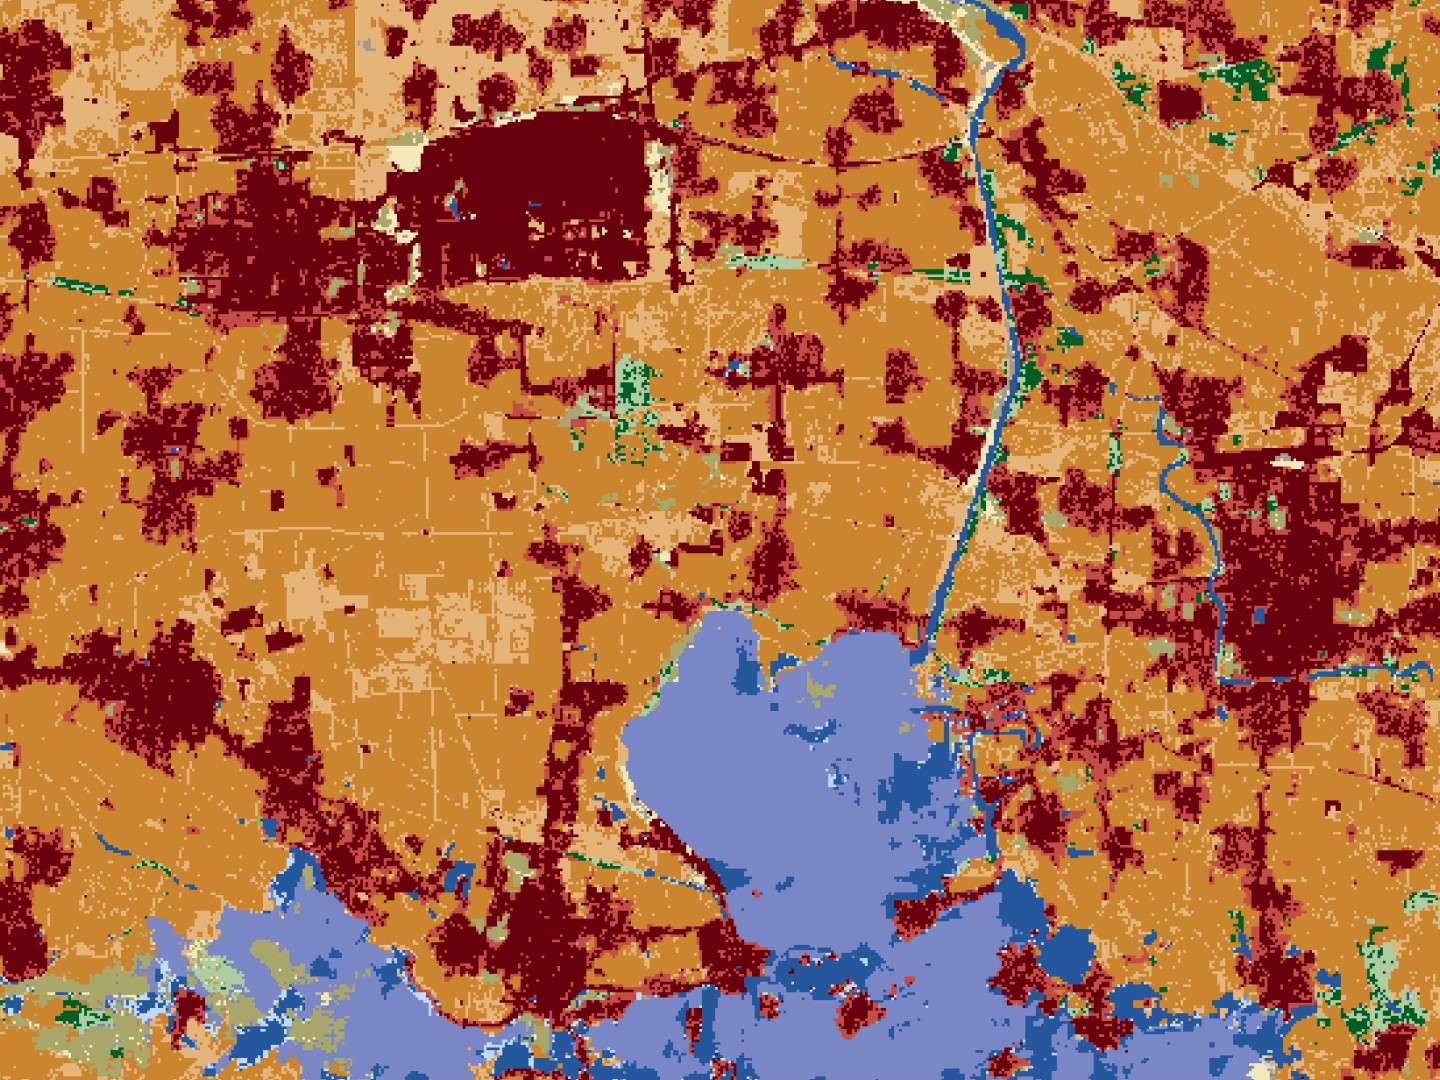
Reveal the patterns of urban development
See the distribution of populations and the magnitude of urban expansion with High Density and Low Density Built Area classes.
Urban Sprawl and Human Expansion Sample Data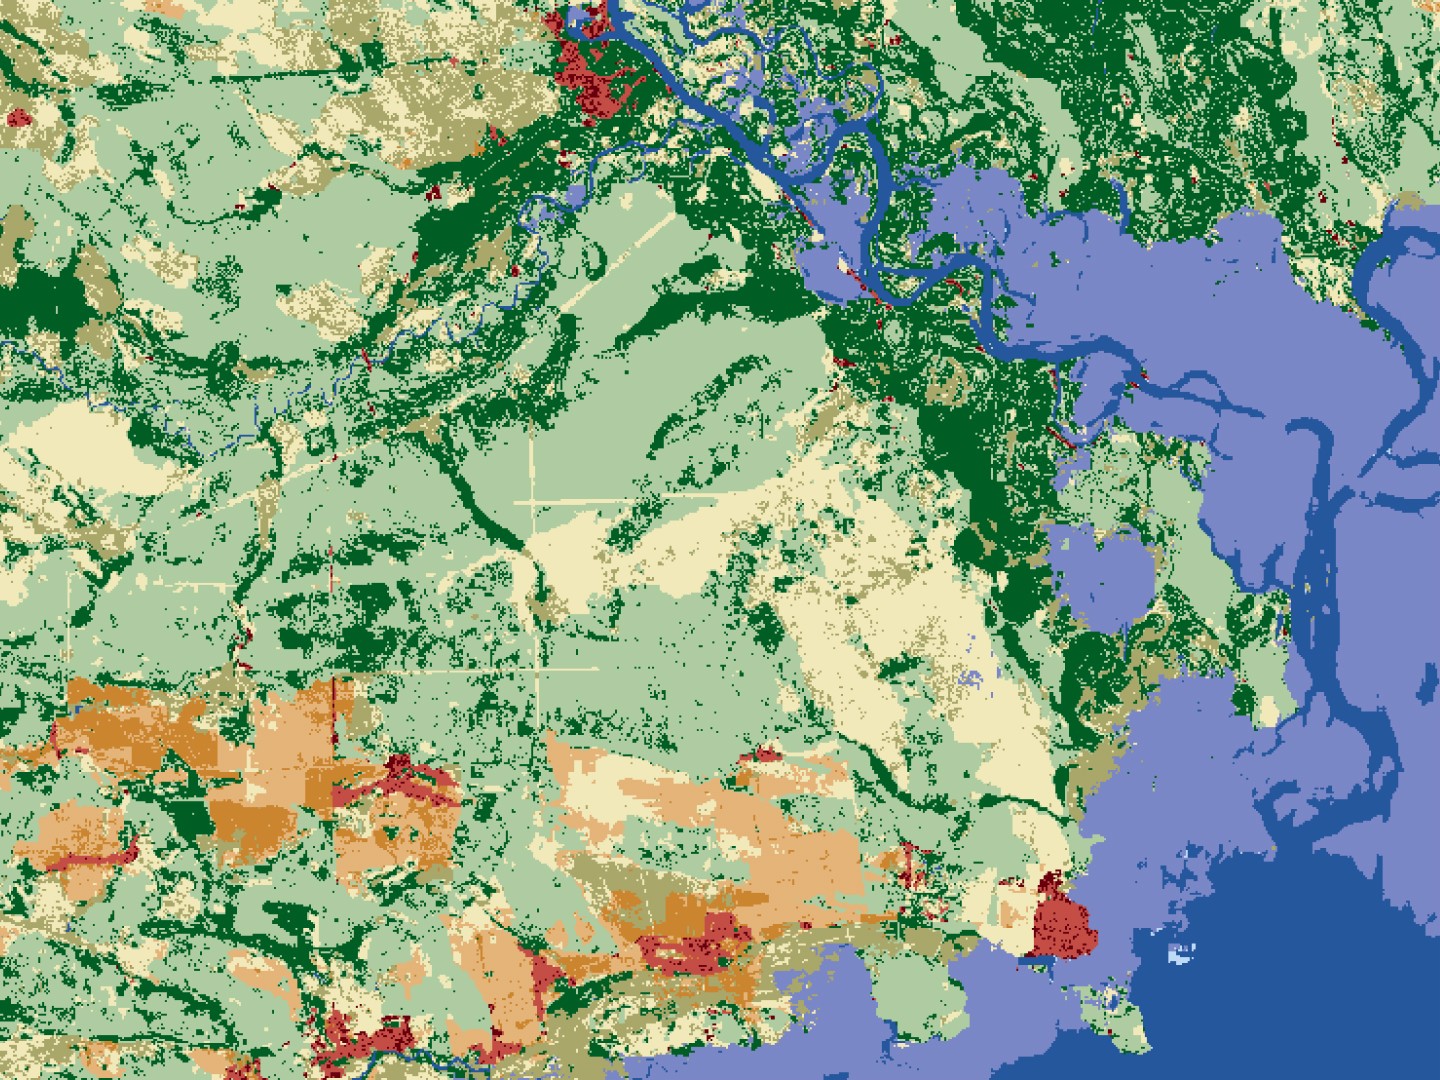
Understand risks to key ecosystems and watersheds
Assess risk of flood or drought, and impacts on critical watersheds and downstream communities based on water levels and vegetation density.
Ecosystems and Watersheds Sample DataOur Land Cover Maps
Find the map that helps you meet your goals, by comparing Impact Observatory's map offerings.
| Maps for Good | 10m Land Cover | 3m Land Cover | |
|---|---|---|---|
| Spatial Resolution | 10 meters | 10 meters | 3 meters |
| Spatial Extent | Custom area of interest | Custom area of interest | Custom area of interest |
| Date Range | Annual | Custom seasonal or annual dates | Custom seasonal or annual dates |
| Length of Archive | 2017–2023 | 2017–Present | 2020–Present |
| Best Suited for | Broad long term land cover analysis | Monitoring dense and sparse vegetation types and built areas, active and inactive croplands, and seasonal water patterns | Monitoring land cover types within urban areas including roads, buildings, mixed vegetation, other built areas |
| Categories | 9 classes Water Trees Rangeland Flooded Vegetation Crops Built Area Bare Ground Snow/Ice Clouds | 15 classes Water Channel Extent Variable Water Persistent Water Dense Trees Sparse Trees Dense Rangeland Sparse Rangeland Flooded Vegetation Active Cropland Inactive Cropland High Density Built Low Density Built Bare Ground Snow/Ice Clouds | 17 classes Water Channel Extent Variable Water Persistent Water Dense Trees Sparse Trees Dense Rangeland Sparse Rangeland Flooded Vegetation Mixed Vegetation Active Cropland Inactive Cropland Building Other Built Bare Ground Road Snow/Ice Clouds |
| Imagery Sources | Sentinel-2 | Sentinel-2 | PlanetScope & Sentinel-2 |
| Available File Types | Cloud Optimized GeoTIFF (COG), PNG and CSV | Cloud Optimized GeoTIFF (COG), PNG and CSV | Cloud Optimized GeoTIFF (COG), PNG and CSV |
| Price | Free | $2/km2 | $7.50/km2 |
Dive into the Details
Explore additional resources to improve your understanding of our 10m Land Cover offering
Documentation
Additional product details, tutorials, and release notes.
10m Land Cover Classes
Get detailed descriptions of each of our land cover classes.
Discover your possibilities!
Create your own custom map or talk to one of our sales team members